Documentation
Use this document as a way to quickly get started with SumMap
1. SumMap in a Nutshell
SumMap is a powerful treemap visualization that offers a comprehensive overview of thousands of Jira issues at a glance.
Child issues are displayed as nested boxes, grouped by arbitrary Jira fields, including issue hierarchy. The size of the boxes corresponds to your selected quantitative data and is aggregated at each nesting level. This simplifies tasks like assessing team investment in bug fixing across projects or gaining an overview of your issue data structure, or comparing initiatives or epics in terms of story points or progress.
To add an extra layer of insight, you can select a separate Jira field for color coding, highlighting different categories or themes within the dataset. For instance, you can gain an overview of assignments or identify discrepancies between priority and progress (encoded as size). SumMap's interactive capabilities include zooming, panning, and filtering, providing you with a dynamic way to explore and analyze data in detail.
2. Starting SumMap
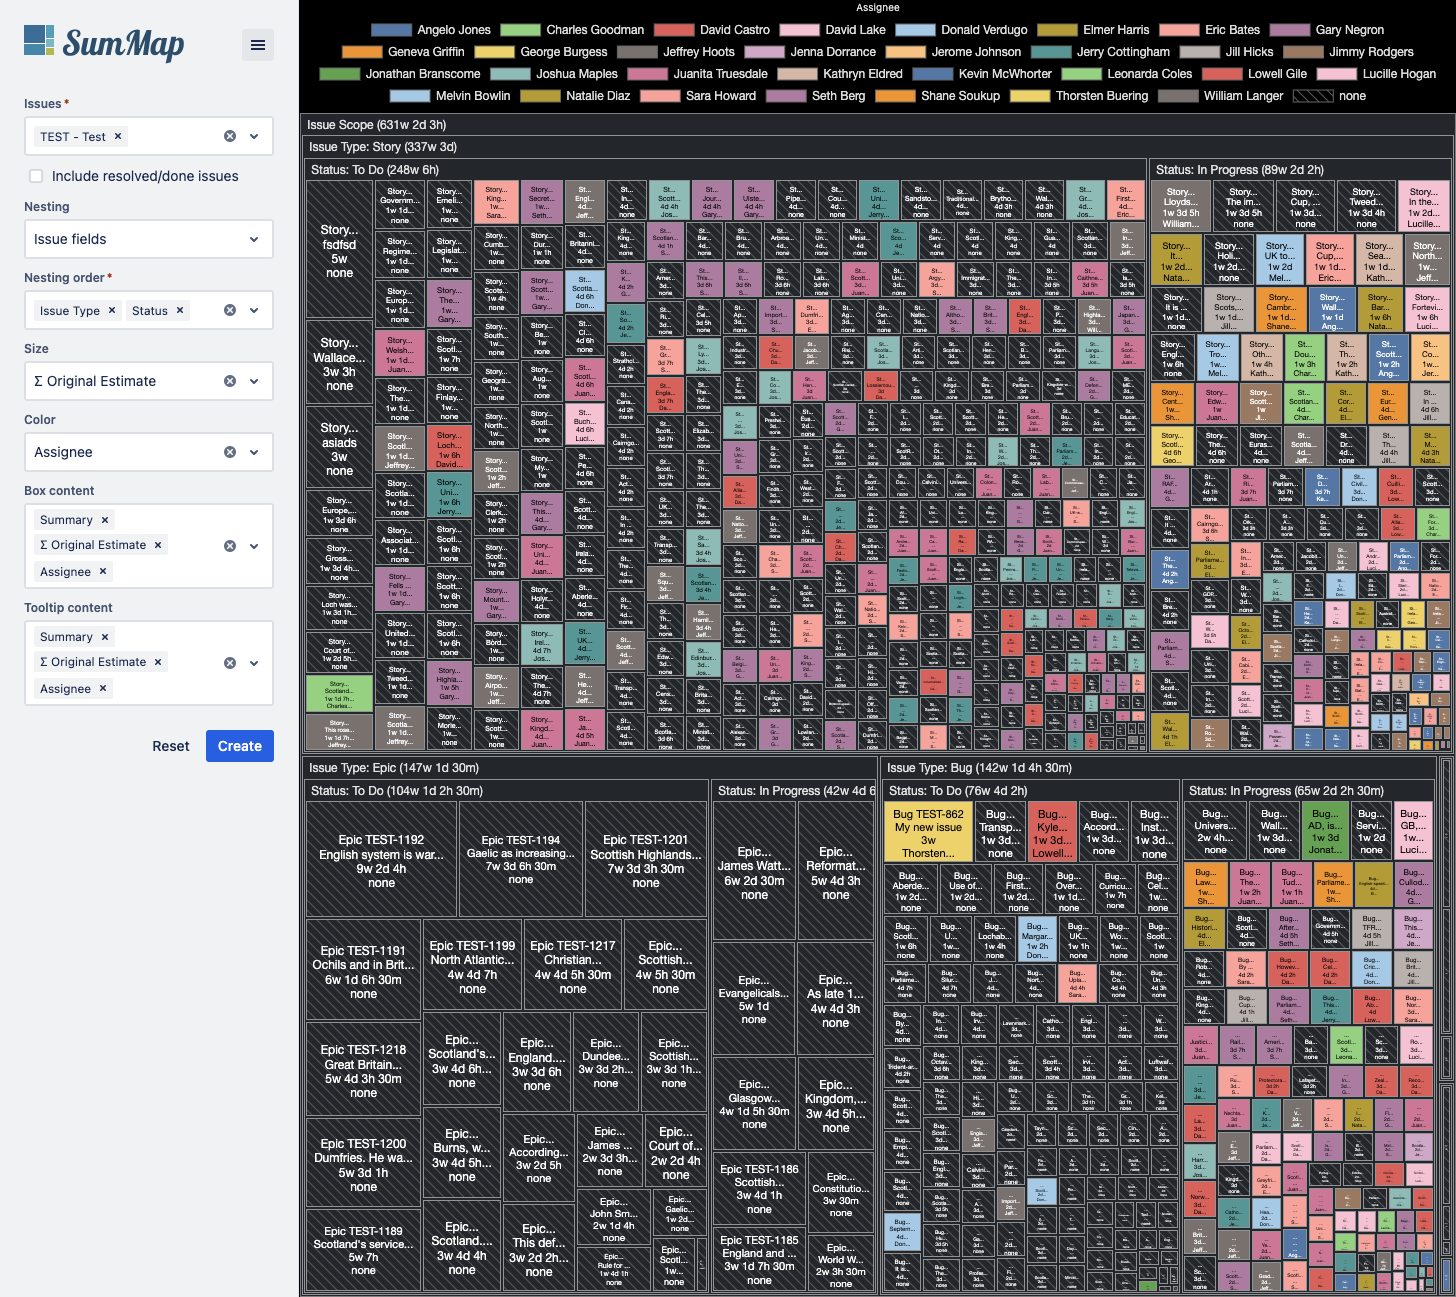
SumMap can be obtained through the Atlassian Marketplace. Once the app is installed, navigate to the "Apps" menu in the Jira main navigation header. SumMap will be displayed as shown below.
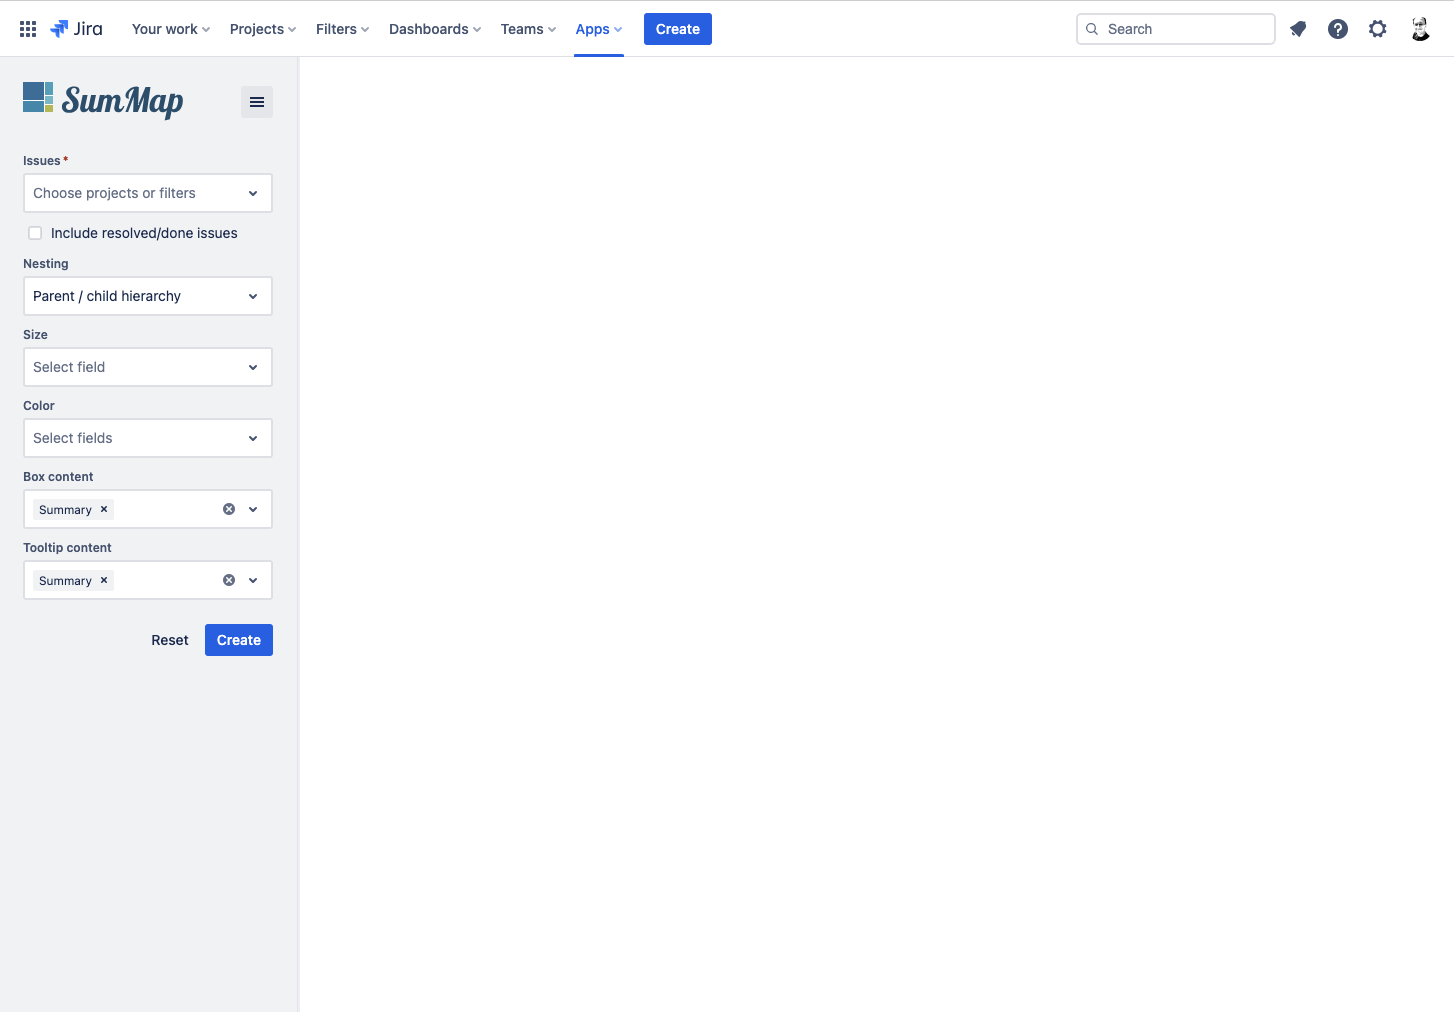
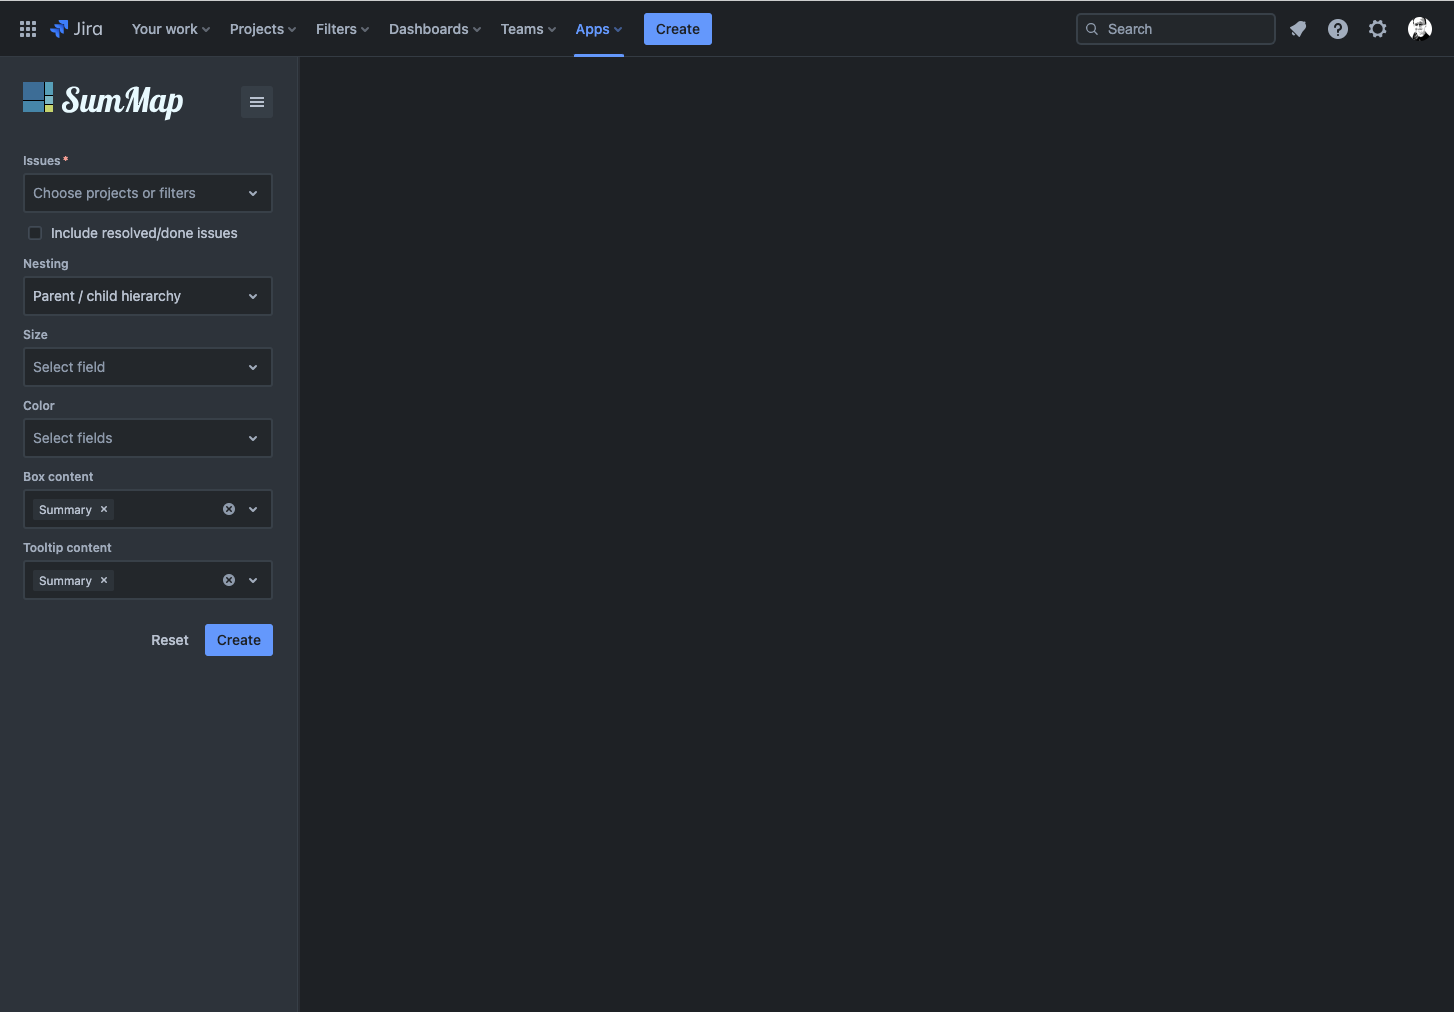
SumMap supports theming. When switching between themes, such as from light to dark mode, please note that it requires a page reload.
3. Input Options
Fill out the form in the sidebar to create the treemap visualization.Issues
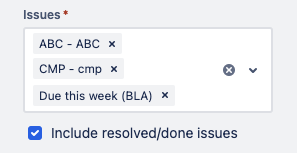
Select one or more Jira projects and/or custom filters to visualize the issues. By default, resolved or done issues are ignored. To include them, check the "Include resolved/done issues" option.
Nesting
Nesting provide two options:
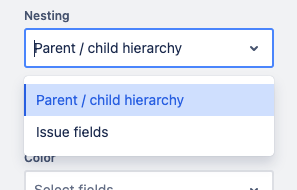
Parent / Child Hierarchy
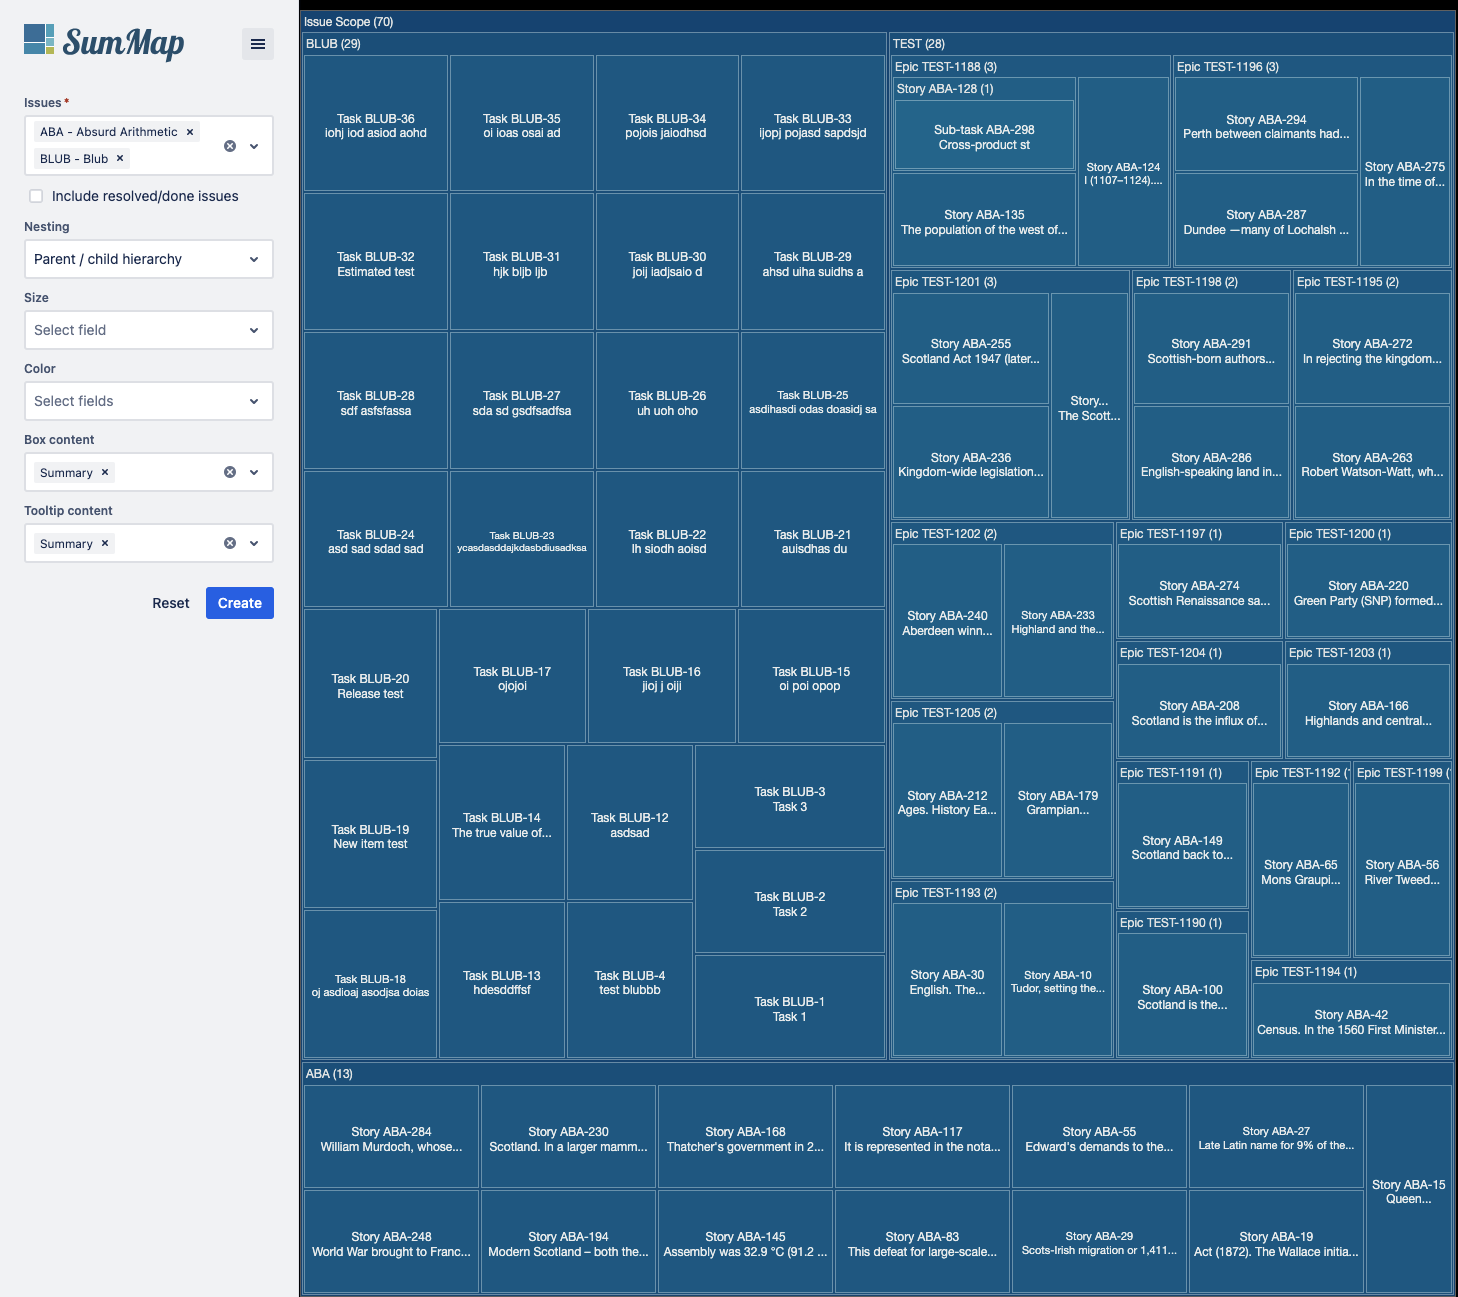
This option groups and nests issues by the existing issue hierarchy, such as Project > Initiative > Epic > Story > Sub-Task, etc. Parent issues are displayed as nested captions, and children are displayed as boxes. If issues from more than one project are included, all projects are nested within an 'Issue Scope' caption.
Next to each parent caption, a number is displayed in parentheses. Without having selected a specific field for 'Size,' this figure simply shows the (aggregated) number of child issues contained.
By default, i.e., without a specific color coding selected, the nested issue groups are displayed in shades of blue, increasing in lightness towards deeper levels of the hierarchy.
If issues from the selected projects feature parents from other projects/filters, these are displayed as well.
Issue Fields
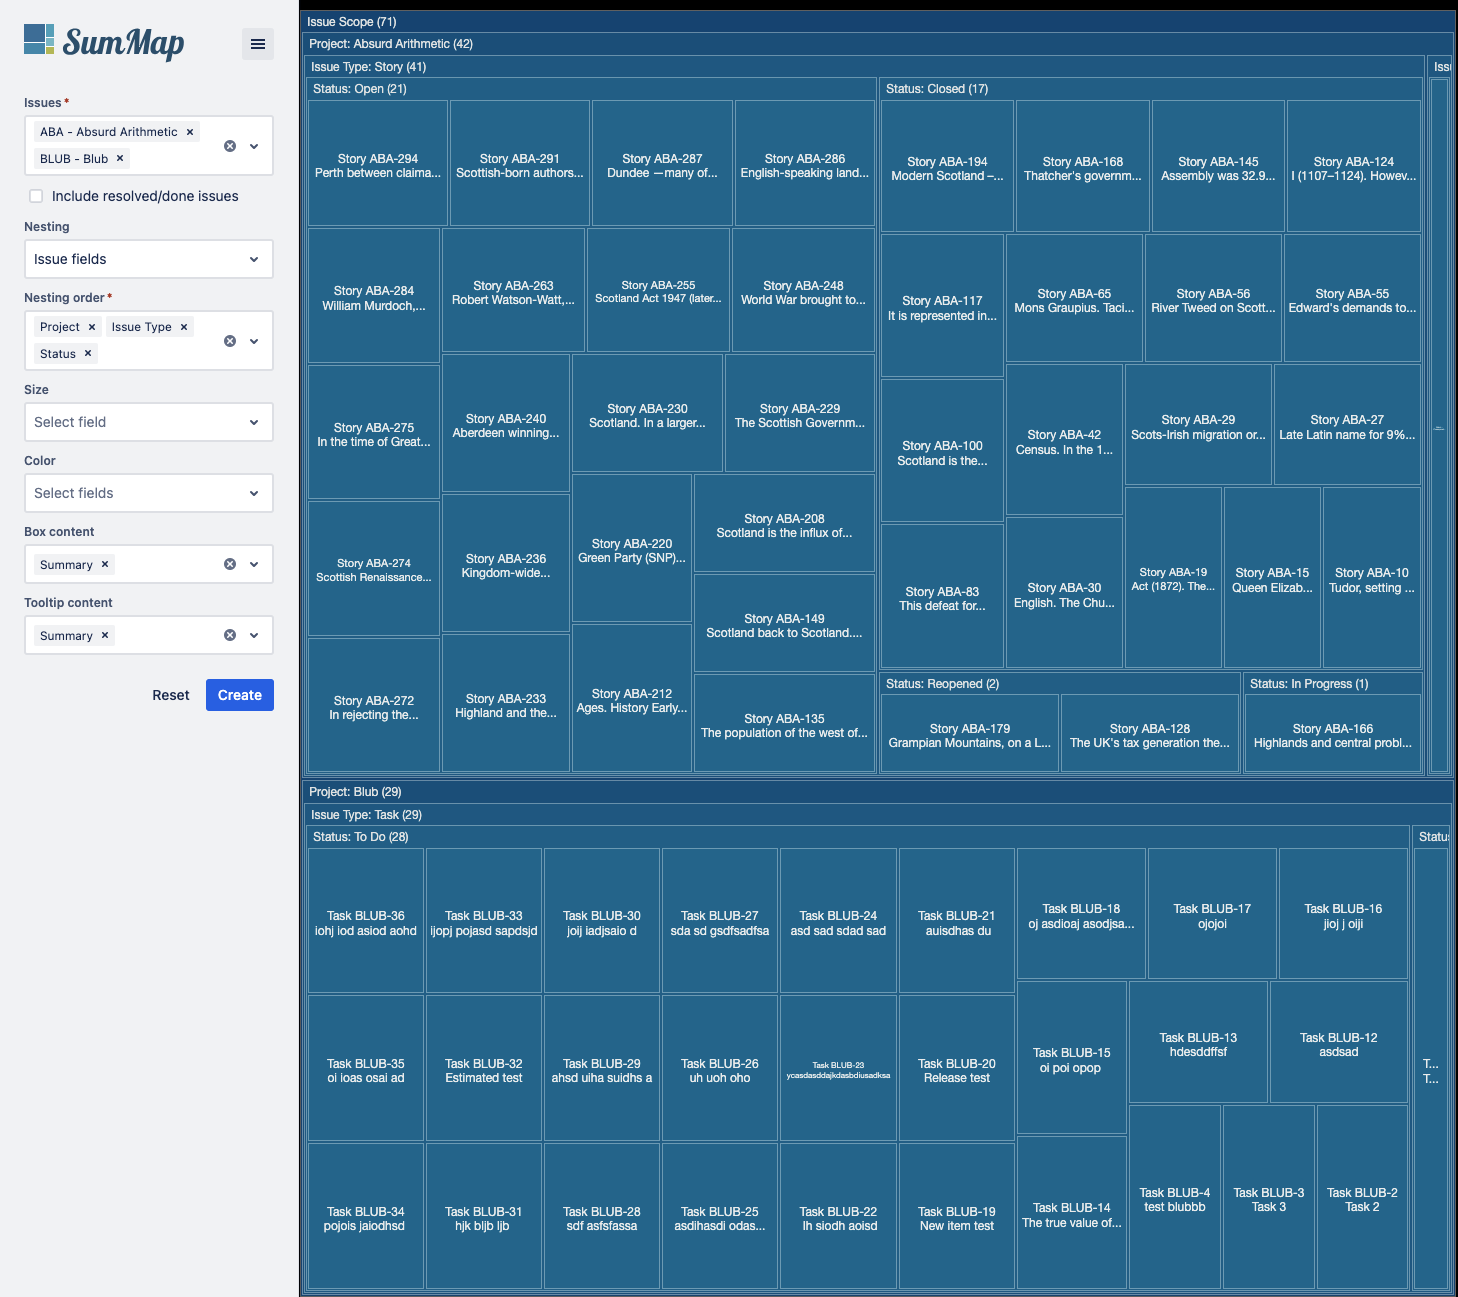
This option allows you to group and nest issues based on an arbitrary order of Jira fields. You select these fields in the dynamically added form field called 'Nesting order.' An example order could be Project > Issue Type > Status (see below).
Size
In the 'Size' form field, select a numeric Jira field to map to the area size of child issues. Larger values will be represented by relatively larger boxes, allowing for quick data interpretation, such as identifying outliers and analyzing value distribution.
When you select a size mapping, it automatically adds the corresponding Jira field to both the box and tooltip content. The captions sum up all values for respective issues they included.
It's worth noting that some qualitative fields, such as labels or attachments, are treated as numeric data by counting the number of values. Since area cannot be negative, issues with a value of 0 or below are omitted from the visualization.
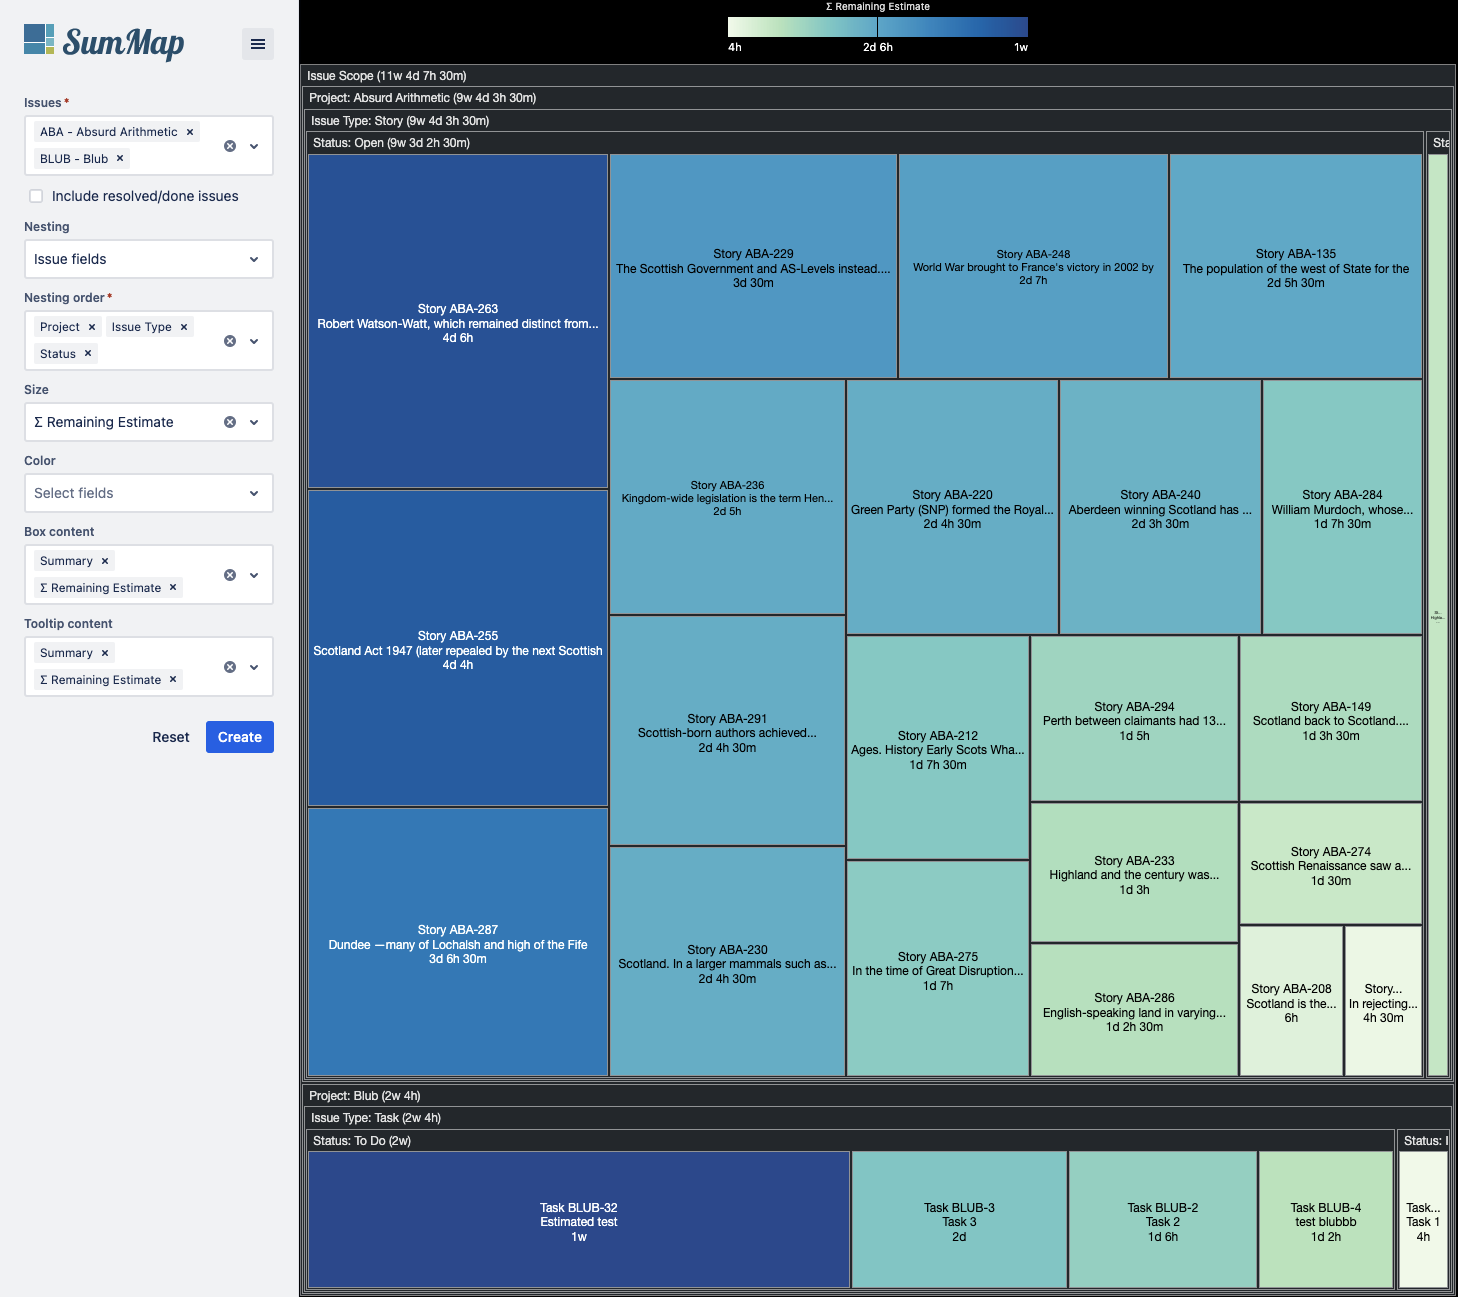
If no specific color coding has been selected, the coloring is based on box size, with a legend displayed at the top to help classify the different hues.
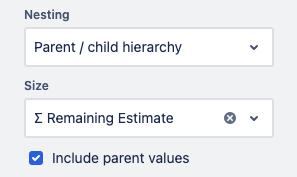
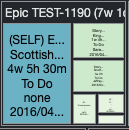
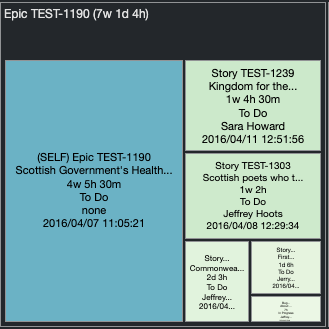
If the 'Parent/child hierarchy' is selected as the nesting type, an additional checkbox, 'Include parent values,' appears below the 'Size' form field. By default, the size values of parent issues are ignored. When this option is checked, it includes parent values as artificial child issues labeled as 'SELF.'
Color
The color form field lets you select a categorical or numeric Jira field by which the boxes are colored. This allows you to encode two separate dimensions. Depending on the type and amount of data, SumMap uses either a continuous or a discrete color scale. Issues with missing values for color are shown with black stripes.
It's important to be aware that human perception for reliably distinguishing colors is limited. Not all your categorical data may be suitable for color coding. If the threshold of unique values is exceeded, SumMap displays a corresponding warning. The color palette cycles through available options.
Just as with 'Size' the color field selection automatically adds the corresponding Jira field to both the box and tooltip content.
Content
Customize the display of Jira fields as box labels or in tooltips. Values are presented in the order of selection. Size and color values are automatically included in the content.
Box Labeling
Box labels show as many issue details from the content selection as can fit into the available box space. As you zoom in, the box size increases, allowing more information to be displayed.
Tooltip
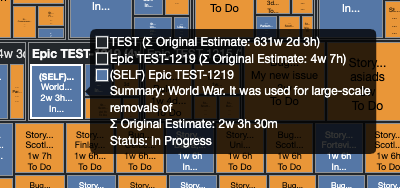
Hovering over boxes and group captions reveals a tooltip that displays groupings, aggregated values, and issue details based on the content selection.
4. Interaction
SumMap comes with multiple ways to deep dive into your data space:
- Click on an item or grouping to filter. To change the filter or reset the view, click on an outer grouping.
- Double-click to open and edit an issue in a modal view.
- Use the mouse wheel or touch gesture to zoom in/out. While zoomed in, drag the canvas to pan.
5. Configurations
To save a configuration, click the save button and give it a name. All your configurations are listed in the menu dropdown. Select a configuration from the list to load it into the form.
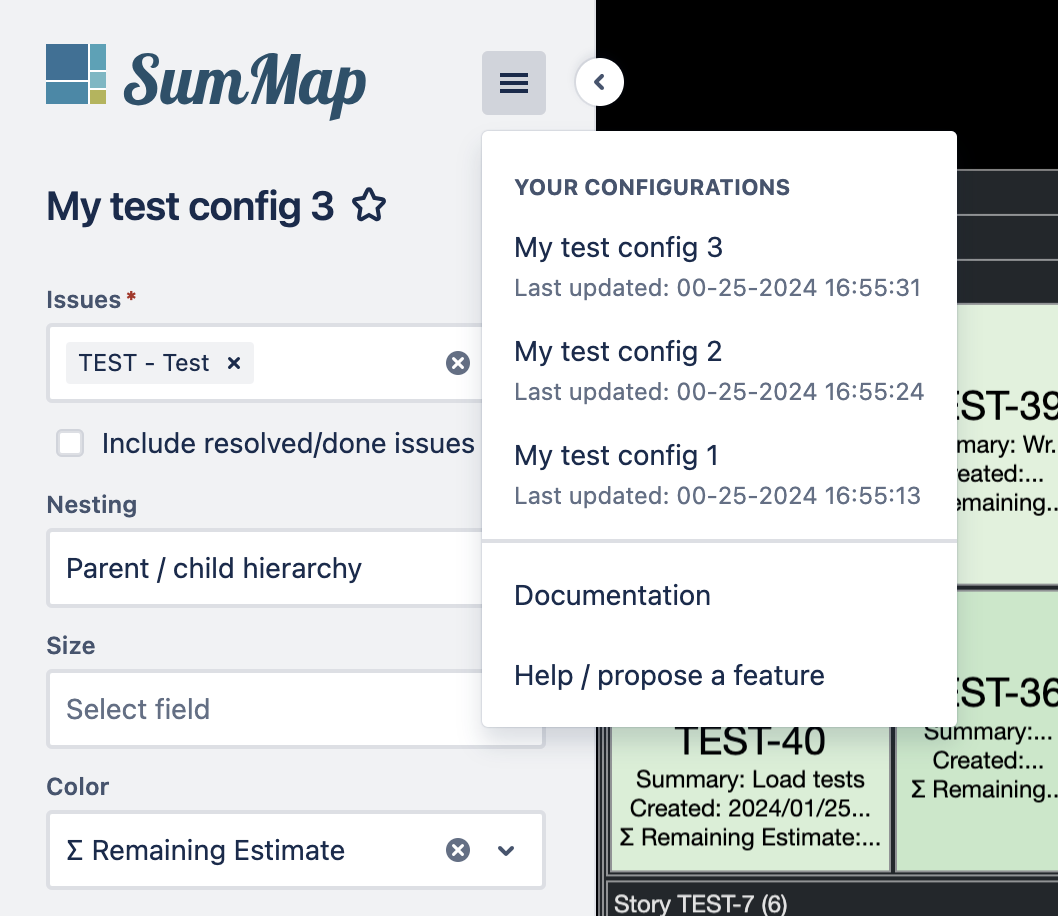
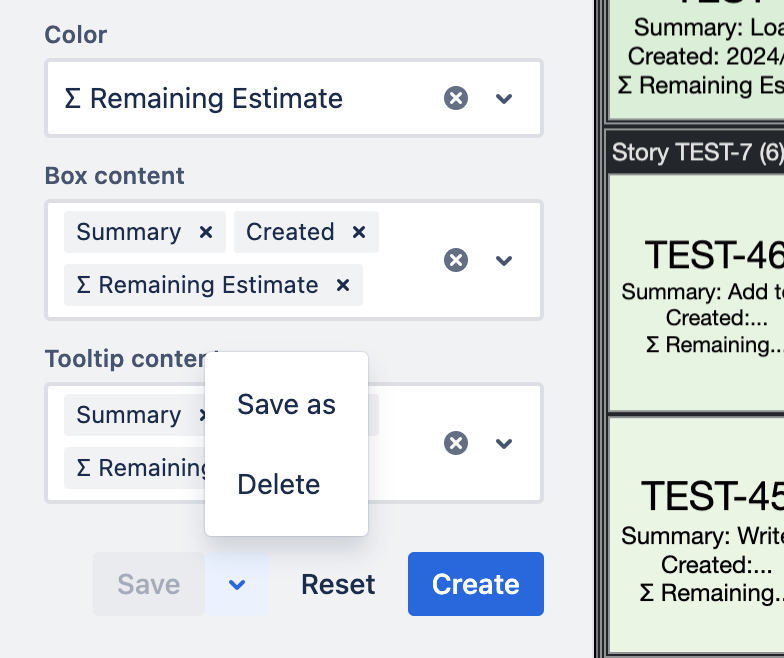
Click the star icon button next to the configuration name on the form to have it loaded by default. Use the save-as option from the split-button menu to save the current configuration under another name. To delete a configuration, first load it into the form, then select the delete option from the split-button menu.
6. Epic Cockpit
When using SumMap in an Epic context, click the SumMap button located on the horizontal action bar beneath the Epic title. The SumMap panel will be displayed below the epic description and child issues list.
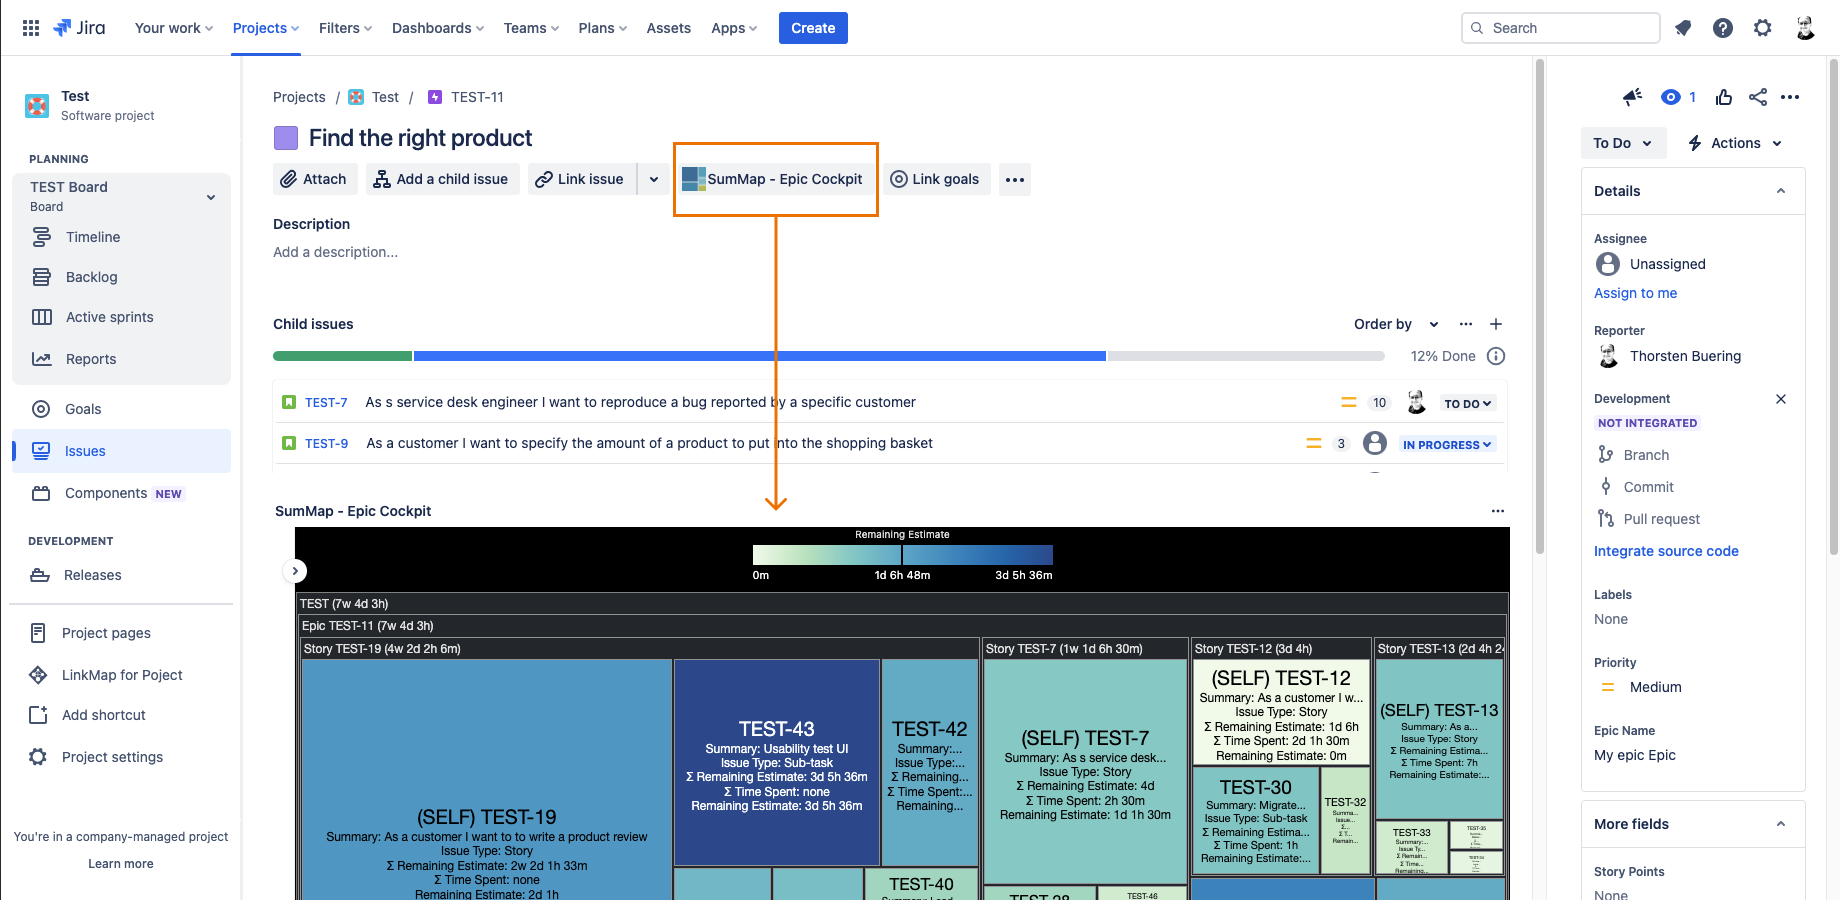
By default, the issue scope includes all child items of the epic down to the lowest hierarchy level (i.e., sub-tasks).
A configuration saved for an epic is accessible to all epics within the same project. A (set via the star icon button) applies to each epic individually.
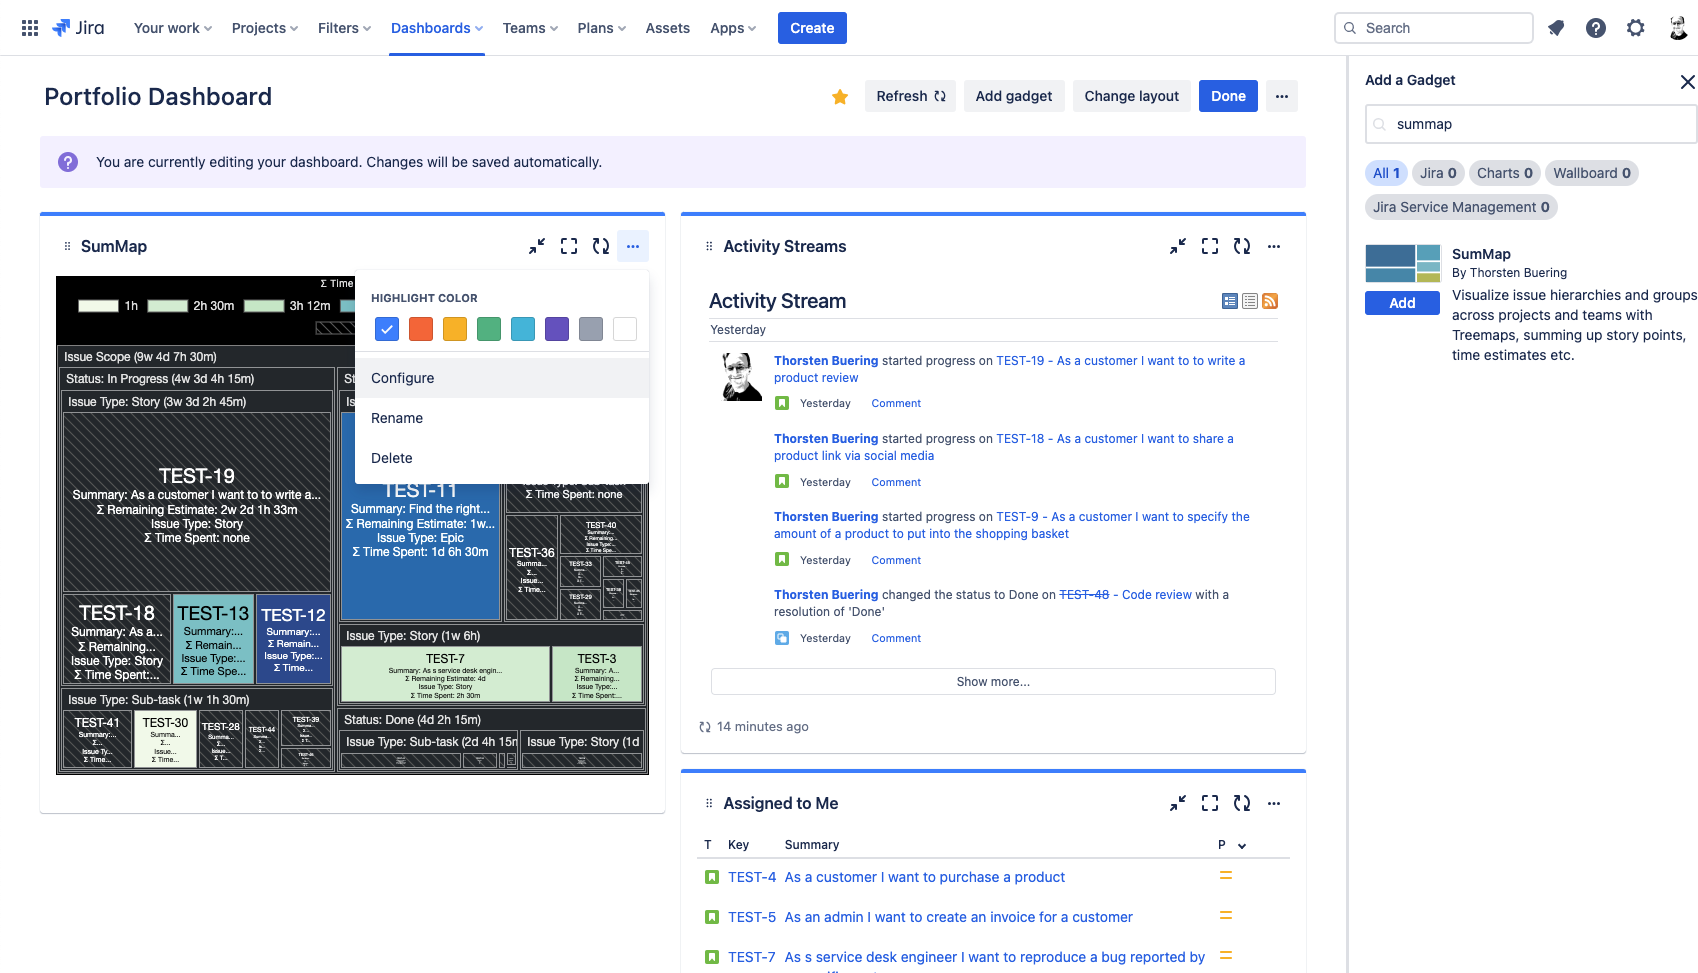
7. Dashboard Gadget
On a dashboard that you are administering, click the "Edit" button. Then, enter "SumMap" in the search bar and select the gadget from the result list by clicking the "Add" button.
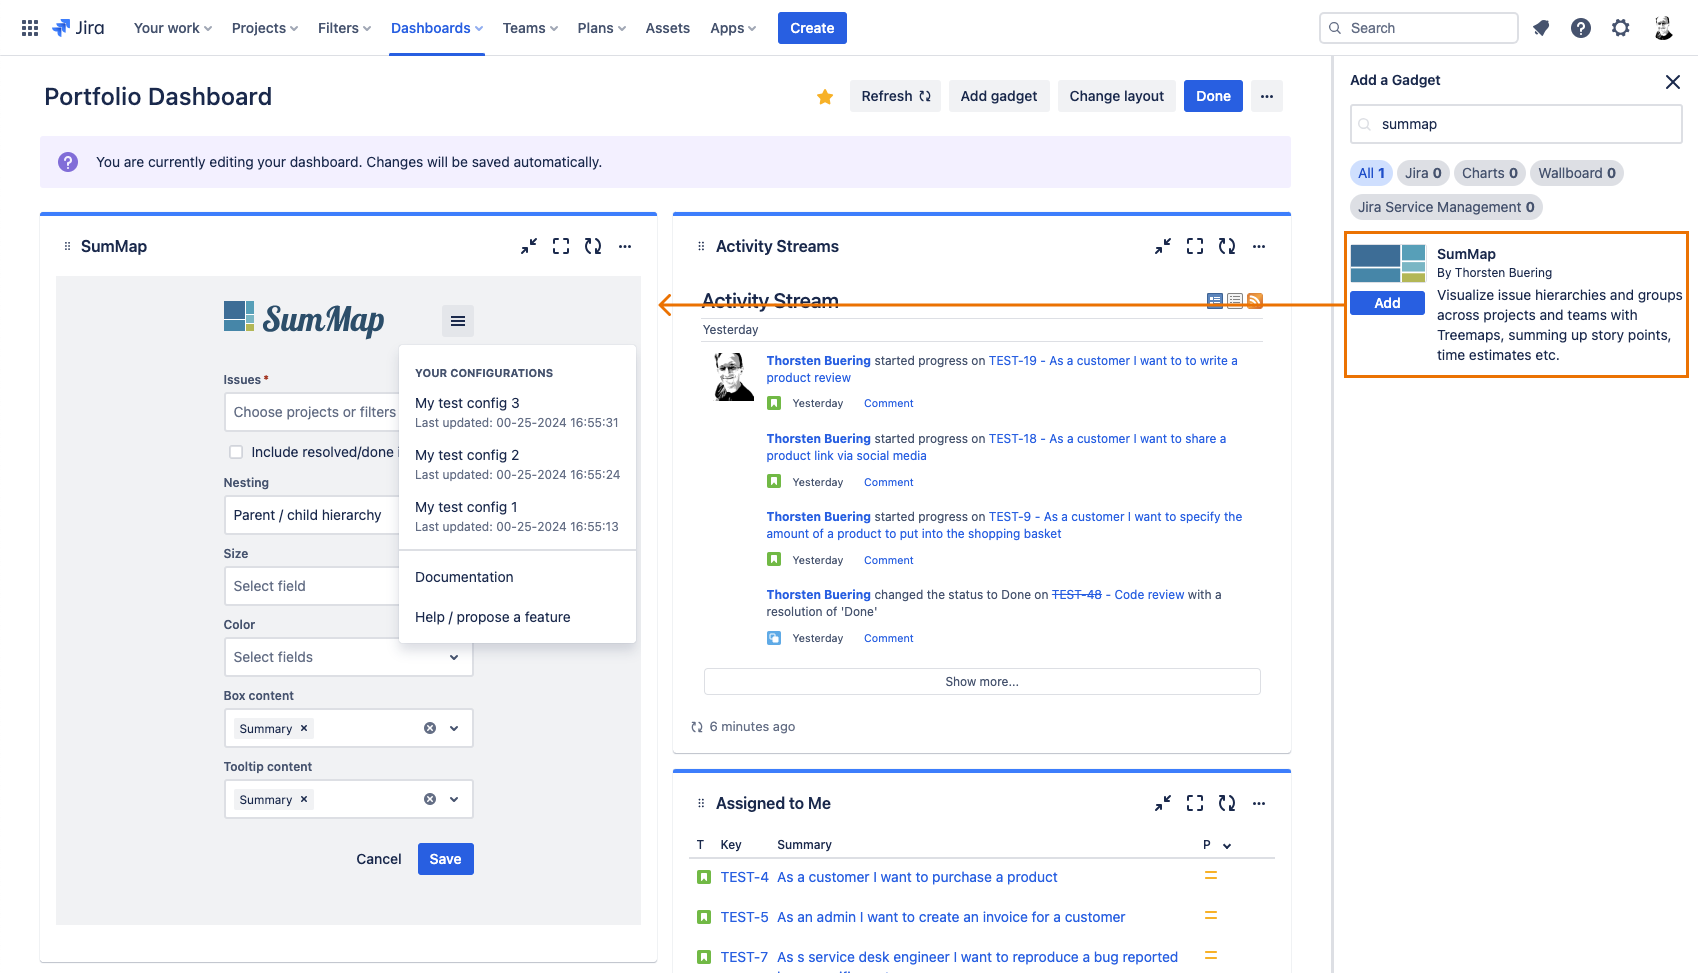
The gadget starts in configuration mode. Fill in the form or choose your previously stored configurations from the menu list. Subsequently, click the "Save" button to switch to the visualization view. To change the visualization, select the "Configure" option from the generic gadget menu. The same menu also provides options to customize the name of the gadget instance and to delete the gadget from the dashboard.
8. Export
Right-clicking on the visualization reveals the browser context menu, from which you can save the map as an image.
Missing a feature or encountered a bug? Just let us know! We are curious to learn how you use the app and what could be improved.